How-to pull Prometheus compatible statistics.
What is the Prometheus compatible output
Prometheus is an open source metric and monitoring service. Its strength is storing statistics efficiently which you then can use to run queries on. You'll be able to poll multiple servers, bring them together and review the statistics, analyse the server status and flag potential problems much easier by bringing them together.
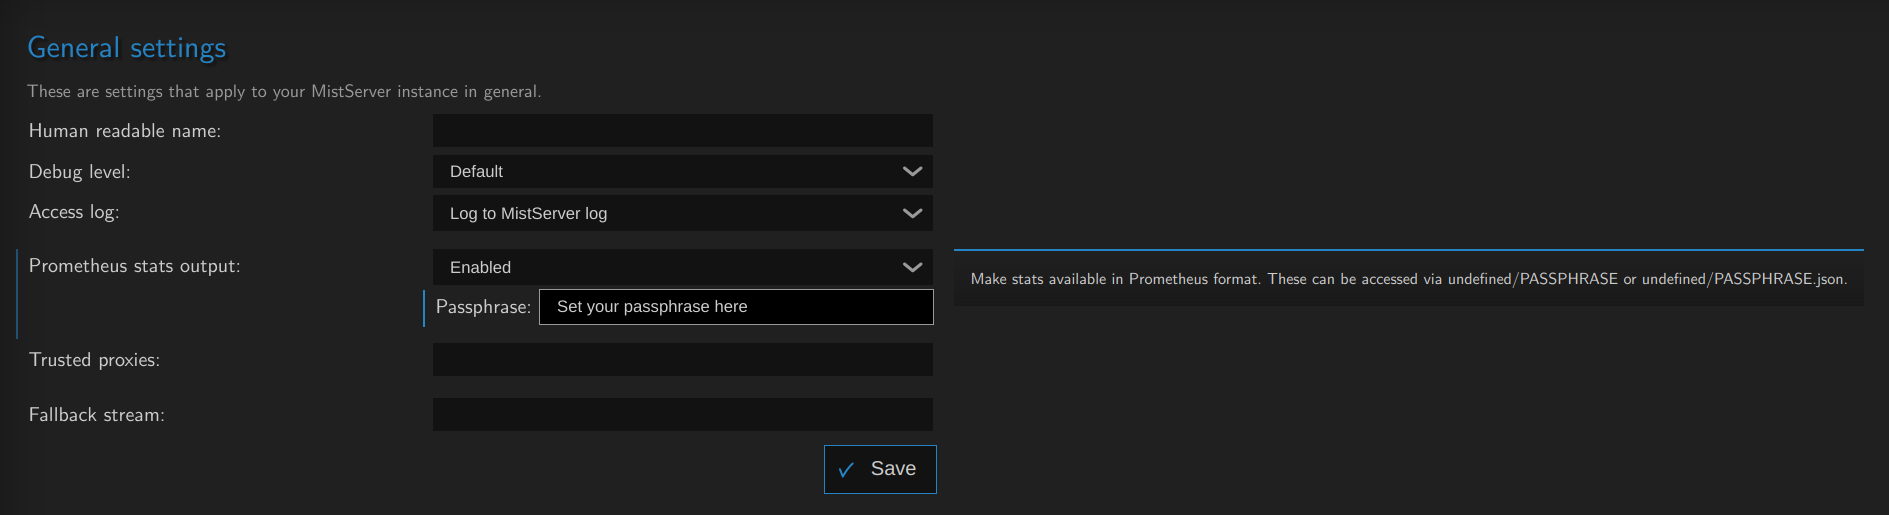
Within MistServers general settings you can set a prometheus passphrase. Enabling this starts the prometheus compatible output for all statistics within MistServer. Once activated you can access them directly using the links:
- http://mistserveraddress:4242/prometheuspassphrase
- http://mistserveraddress:4242/prometheuspassphrase.json
Polling these at a steady interval will give you pretty much anything you would need metric-wise from MistServer. In case you are wondering whether the statistics are of any use to simply visit the http://mistserveraddress:4242/prometheuspassphrase link.
Wondering if the statistics are interesting for you? Set up the prometheus passphrase while your server is in use and visit the http://mistserveraddress:4242/prometheuspassphrase . You will see all the statistics it provides and you should get a good picture whether this is worth the time investment.
We recommend installing VictoriaMetrics for scraping (collecting) & storing the metrics and Grafana for making human friendly panels to explore the metrics.
Why do I want Victoriametrics and Grafana for analytics?
MistServer has a tremendous amount of data available and in use to optimize streaming workflows with the sole intention of running in the moment. MistServer itself does not store this data anywhere as it would quickly flood your server storage. Data collection applications such as VictoriaMetrics are made to specifically counter this problem and are capable of scraping the data and storing it with superior compression. Grafana in turn is an application made to make data like this what we call "human friendly". Providing graphs, bars and other visual representations of the data easy to understand.
Best practises for setting up your analytics server
As you might have guessed using VictoriaMetrics and Grafana will require some resources therefore we recommend running it on a different device than you are running MistServer on. This is for a few reasons, but the most important being that you would want your analytics collection to keep going if your MistServer instance goes dark for some reason or has run into trouble.
As such we would recommend setting up a server whose sole focus is to get the analytics from your MistServer instances. It can be any kind of server, just make sure it has access to all your MistServer instances.
Requirements
- One or more running MistServer instance(s)
- A server with connection to all MistServer instances you want to capture analytics from
The steps to follow
- First we will choose an operating system
- Then we will install VictoriaMetrics & Grafana
- Afterwards we will set up Grafana
- Lastly we will show some default MistServer dashboards for Grafana as a template
01 OS/Server Selection
While VictoriaMetrics is able to run in nearly any OS and has docker images available as well our personal preference goes to running it on a dedicated Linux server. Linux allows us to throw a very minimal OS on the server and fully dedicated it to the task of data collection. Other OS tend to add unnecessary features and complicate usage.
If you do want to use a different OS please feel free to do so, with the exception of the actual installation process the rest of this guide should still help you set everything up.
Pretty much any Server/OS can run this so you don't need a strong server, reliability is more important.
02 Installing VictoriaMetrics and Grafana
VictoriaMetrics
VictoriaMetrics is wide-spread since its release in 2018. By now it's almost certainly in the default package managers for your Linux distro. If for some reason it is not we would recommend manually installing it using their available downloads.
Setting up VictoriaMetrics
Now before we start, obviously we cannot cover every setting available within VictoriaMetrics. We'll give something to work with. We would always recommend reading up on the applications you're using and determining what settings you want to use yourself as well.
Essentially you're done, however we would recommend some minor tweaks to the boot arguments. This can be done by changing the boot arguments. Now depending on how VictoriaMetrics is installed the arguments could be directly in your service script or link to an EnvironmentFile. You might have to look this up if it is not immediately clear.
The default retention period is 1 month. We will want to edit it to something longer, let's say 120 months. Adding the following to the arguments list will do the trick:
-retentionPeriod 120
Another thing to consider is to change the path where the data is stored. While not strictly necessary we usually change it towards:
-storageDataPath /var/lib/victoriametrics/
Make sure that the user VictoriaMetrics runs as exists and has access to this folder.
Change the default retention period for VictoriaMetrics, as it will only be 1 month without any changes to VictoriaMetrics
Grafana
Grafana is well distributed within the Linux community. You should be able to simply install it as a service using the default installation process for your chosen OS. If for some reason it is not available check for the Grafana website for installation instructions.
03: Setting up Grafana
Through your installation method Grafana should be active and available as a service. If not you can start it simply by booting the executable, but I would look into getting it ran as a service.
Once active Grafana will have an interface available at http://HOST:3000 by default. Open this in a browser and get started on setting up Grafana.
Adding a data source
The next step is to add a data source. To the left you should be able to find a Connections tab, click it and you should be able to add a new connection/data source. There's plenty of options available, however we need to add one for Prometheus.
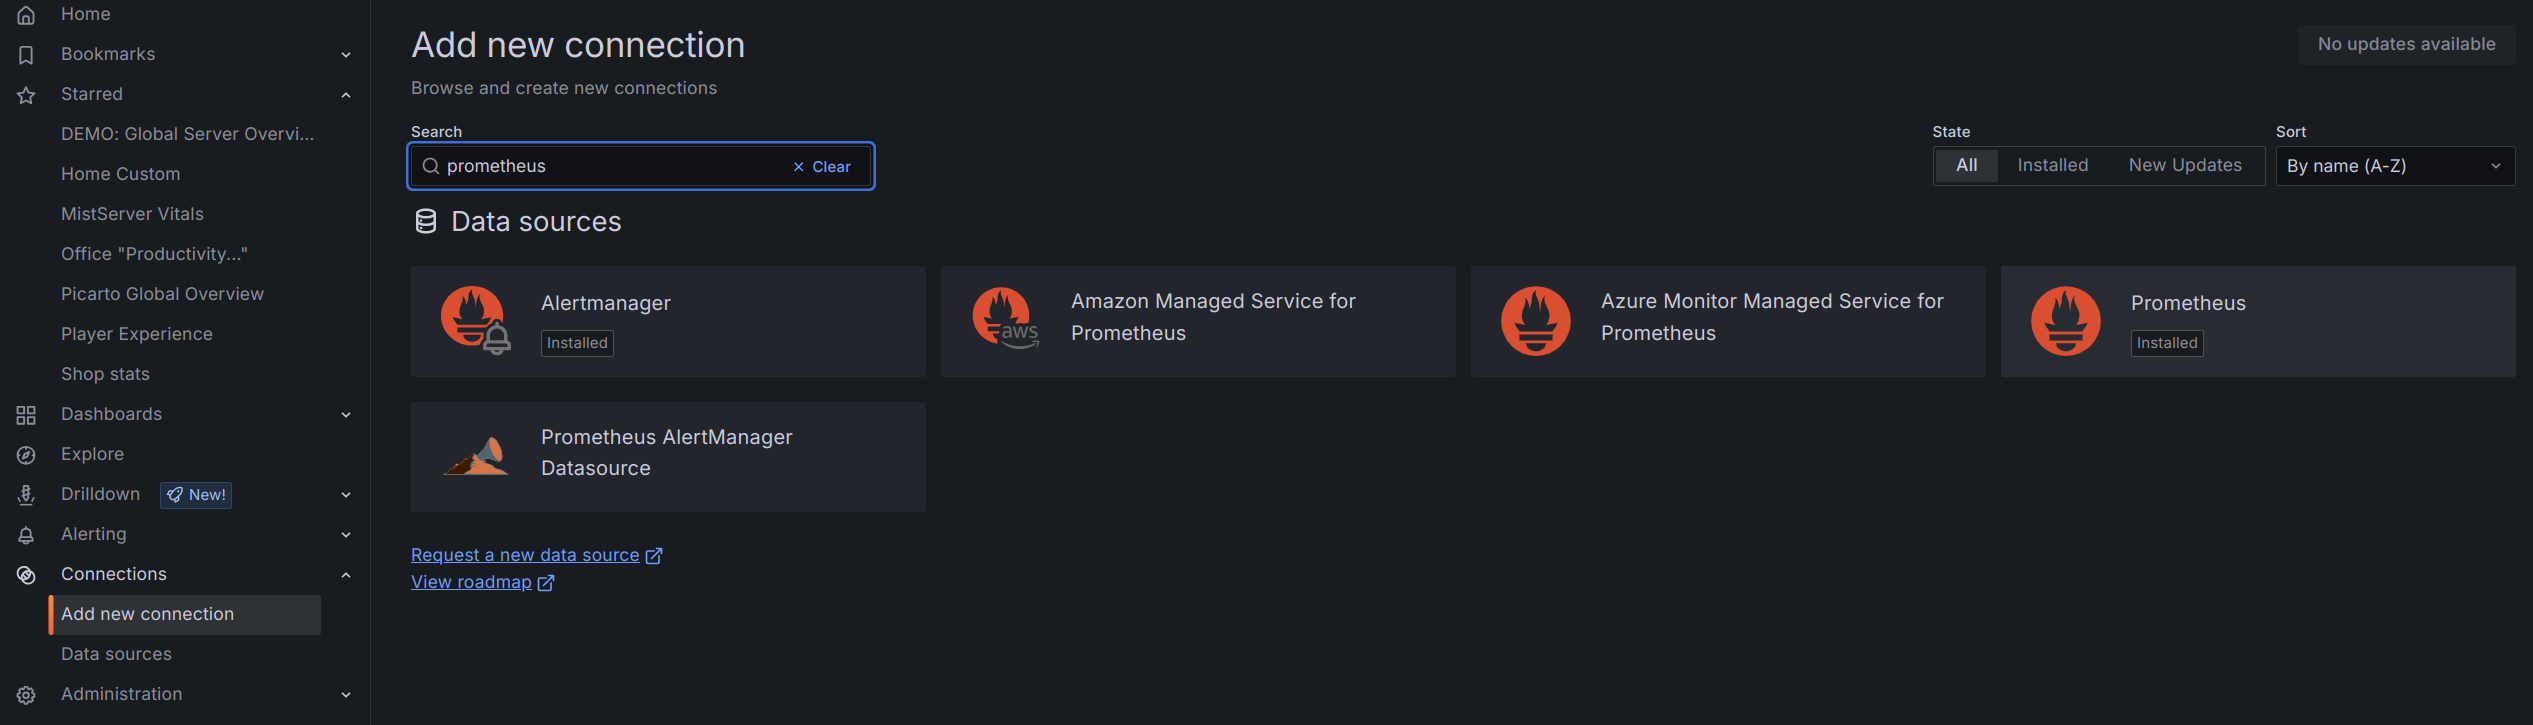
Then once you've selected Prometheus and added it as a source you can set it up.
Nameanything you wantURLhttp://mistserveraddress:8428
Feel free to go through the other options and set them up to your liking.
Depending on your defaults or setup you might have VictoriaMetrics available on a different port. Please verify this if the setup does not work.
4. Adding the dashboard
We've got a few Dashboards available immediately which should give the most basic things you'd want. You can add a dashboard by following these steps:
- Go to the Dashboard panel (available at the left)
- In the top right corner there's
Newbutton, click it and select import
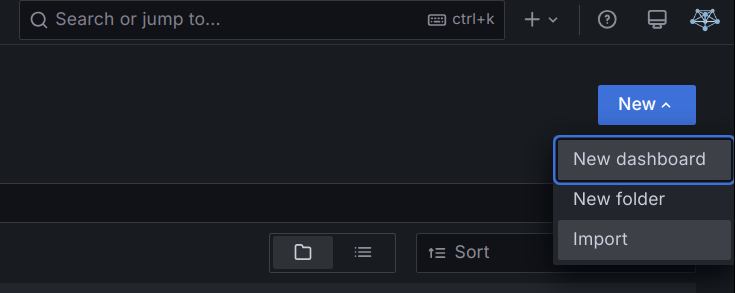
- Fill in what to import.
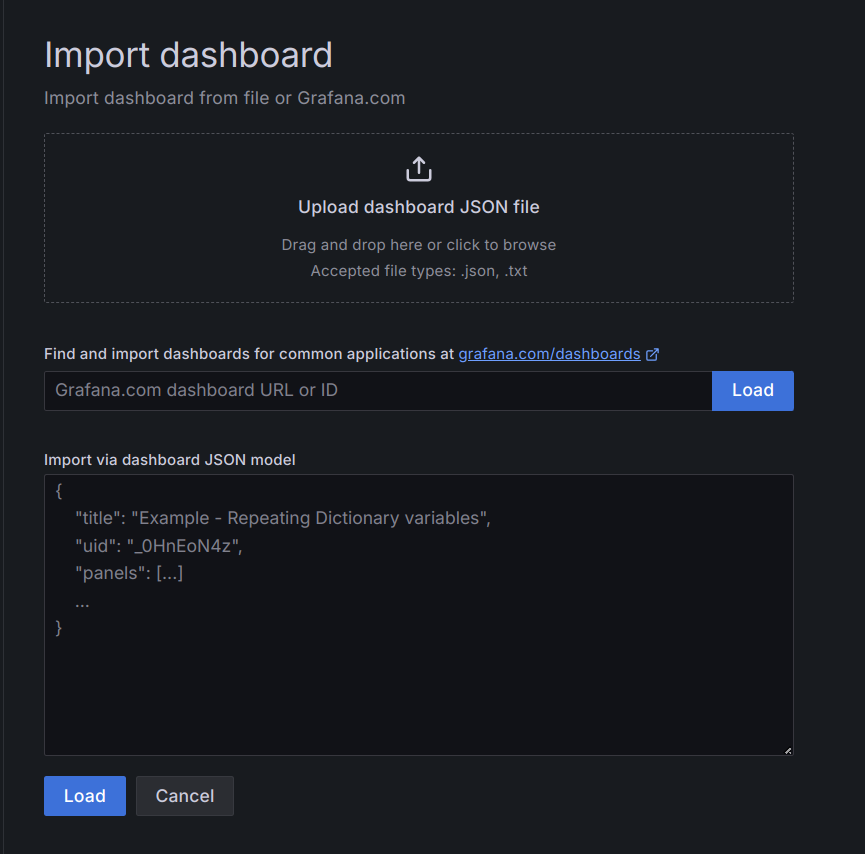
Fill in the Grafana.com Dashboard number with our preset dashboards (for example our MistServer Vitals: 1096)
MistServer provided dashboards
The most up to date list of all of the dashboards created by the MistServer team can be found here on Grafana Labs. Generally we would recommend using these as a base to then edit them to your liking.
MistServer Vitals: 1096
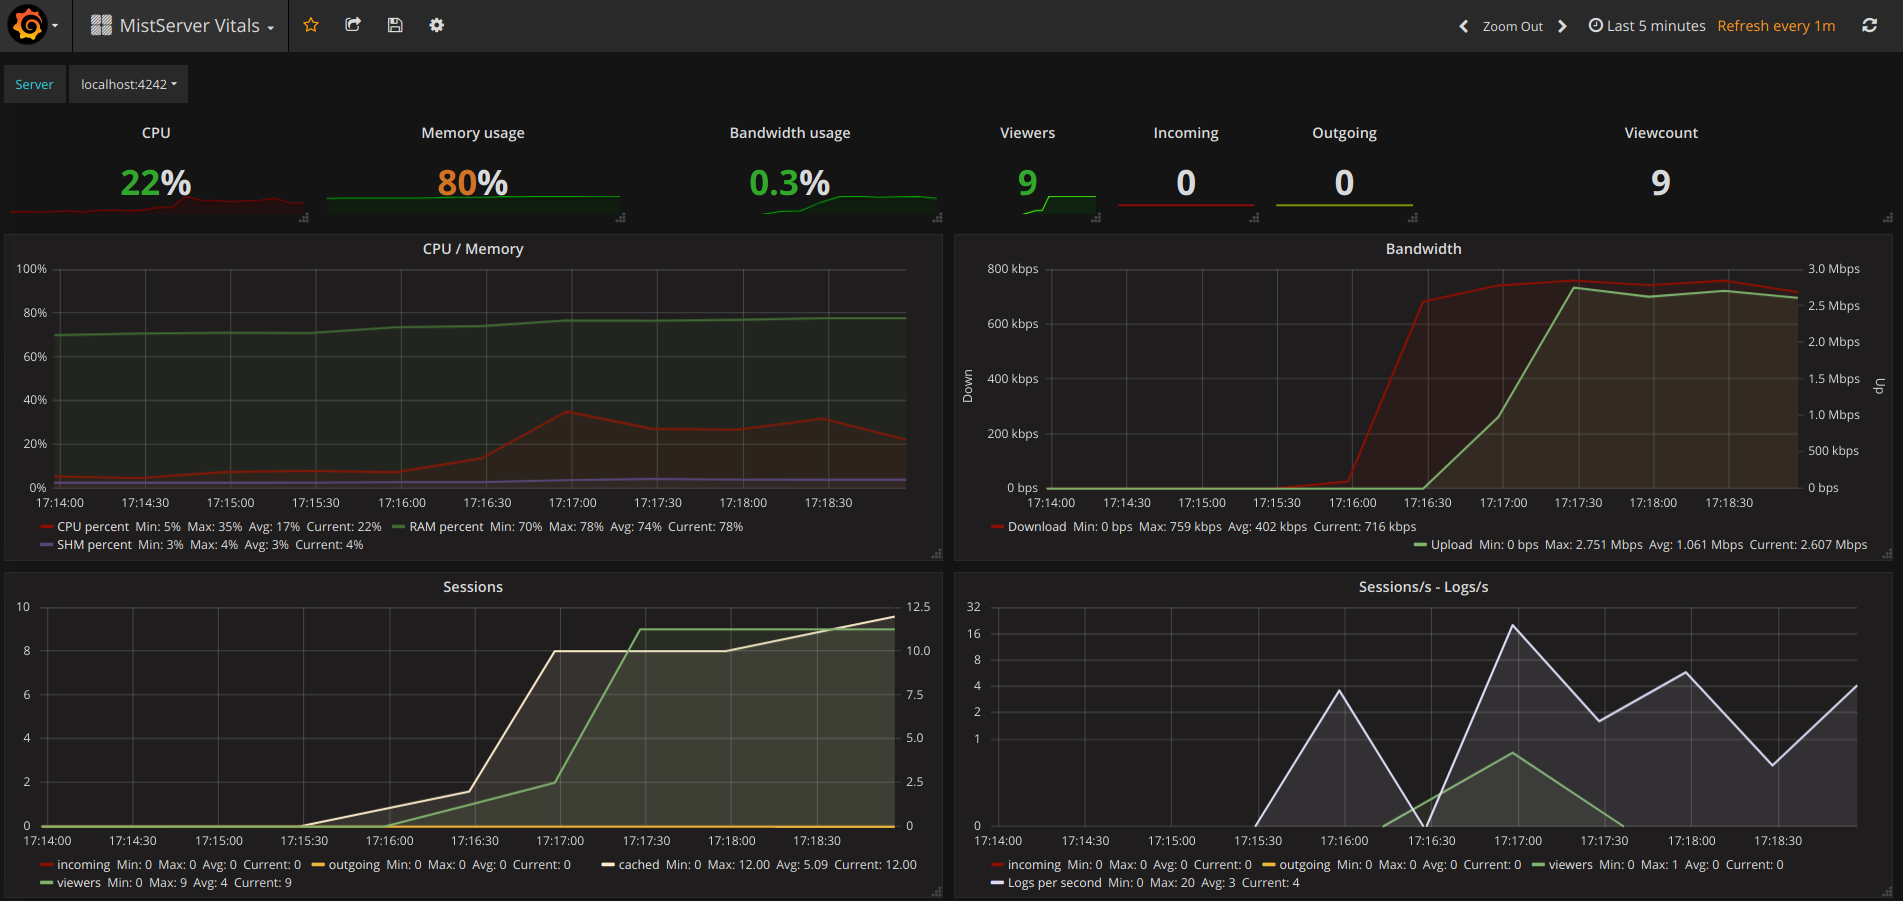
This is our most basic overview which includes pretty much all of the statistics you should want to see anyway. It covers how your server is doing resource and bandwidth wise.
You switch between given MistServers at the top of given panels by clicking and selecting the server you want to inspect.
MistServer Stream Details: 4526
![Image of the MistServer Stream Details Dashboard in grafana][mistserverstreamdetail]
This shows generic details per active stream. Streams and Servers are selected at the top of the panel. You'll be able to see the amount of viewers, total bandwidth use and amount of log messages generated by the stream.
###MistServer All Streams Details: 4529###
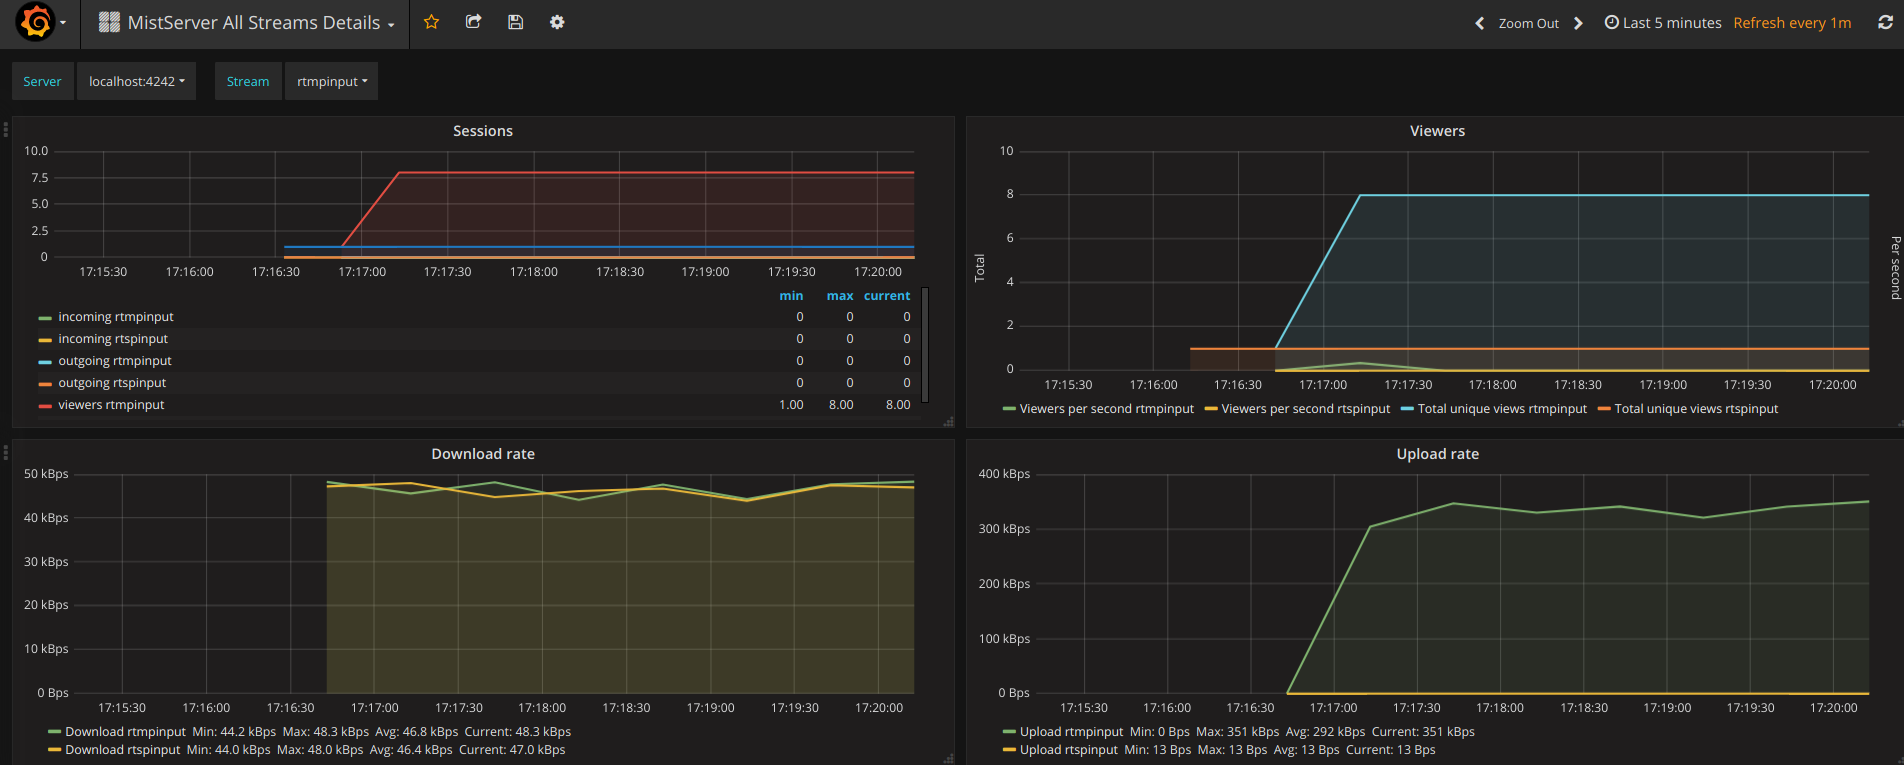
This shows the same details as the MistServer Stream Details Dashboard, but for all streams at the same time. This can be quite a lot of data, and will become unusable if you have a lot of streams. If you have a low amount of streams per server this gives an easy to use overview however.
Old Grafana - Adding data source
Much older versions of Grafana had a slightly different setup where you had to select a Name, Type and URL when adding a Data Source:
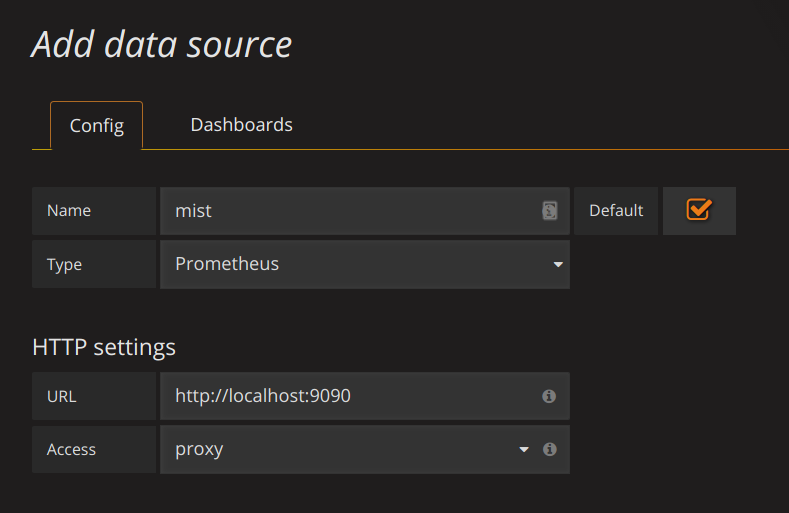
Namecan be anything you'd want.Typehas to be set to:Prometheus(as the datetype is Prometheus styled)URLwill be the location of the VictoriaMetrics interface:http://localhost:8428
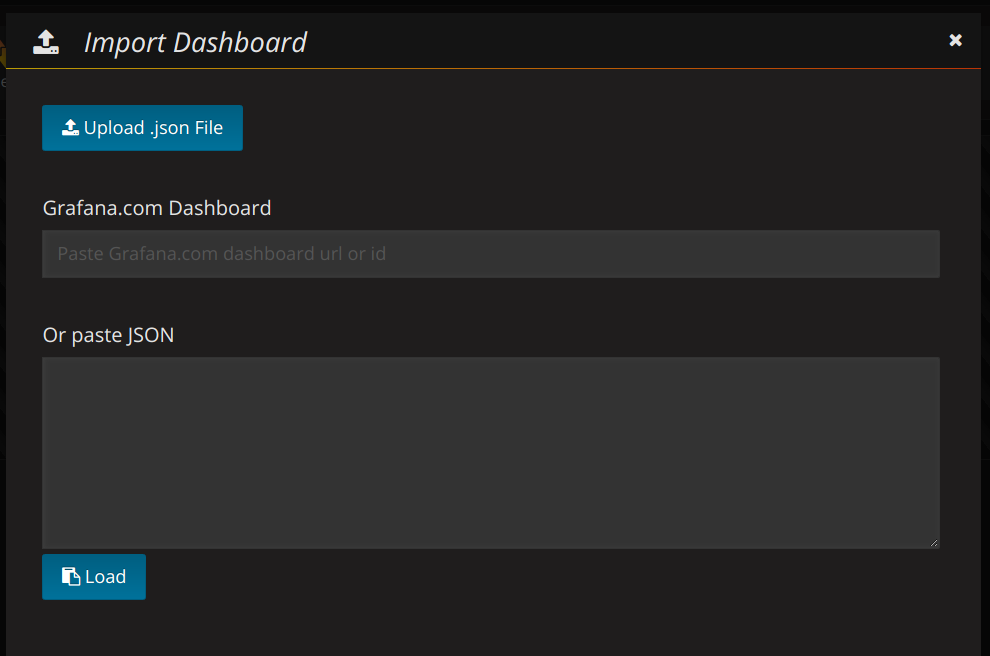
Old Grafana - Adding the dashboard
We've got a few Dashboards available immediately which should give the most basic things you'd want. You can add a dashboard by following these steps:
Click on the grafana icon in the top left corner → hover Dashboards → Select Import
You should see the following
Fill in the Grafana.com Dashboard number with our preset dashboards (for example our MistServer Vitals: 1096)
If recognised you will see the following
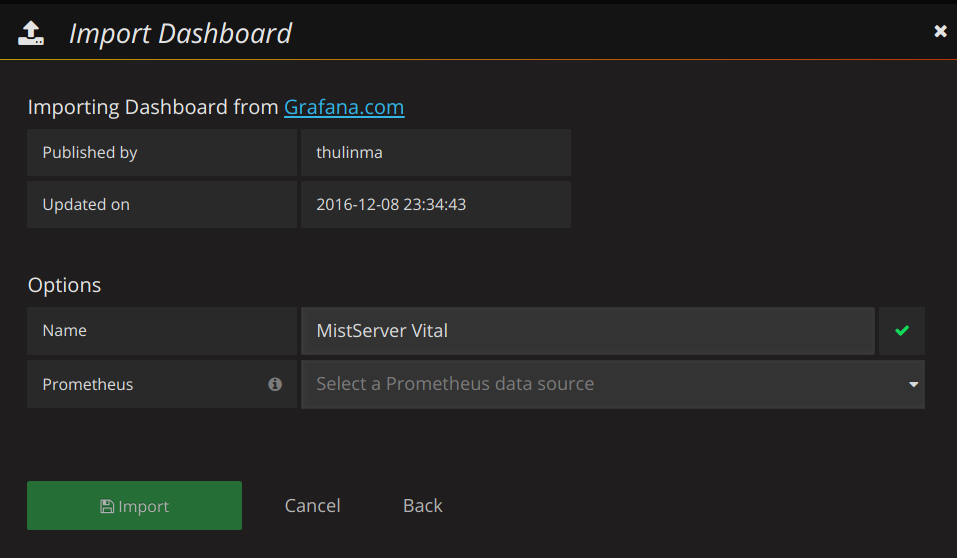
Just add that and you should have your first basic dashboard. Our other dashboards can be added in the same manner. More information about what each dashboard is for can be found below.